We hear a lot nowadays about the many superpowers of AI, but we don't hear much about its highly refined aesthetic sensibilities. Well, that's what I'm here to change! I trained a convolutional neural net to look through thousands of photos taken from on top of the space needle and learn which ones are junk (as a baseline), and even to highlight the most beautiful of the bunch! But while this application may be a bit of pet-project-floof, it's not without a use case: think first-pass filter on a photographer's raw photos; think auto-curated album from your snap-happy vacation.
Abstract
For this project, I've trained a convolutional neural net to look through a gallery of images and then assign scores to each image according to it's quality, allowing a user to apply the algorithm as a first-pass filter to reduce the size of a gallery to review. As an added benefit, the scores can also be used to highlight the best amongst the images. The dataset used for this project is a collection of panoramic images taken of the Seattle skyline by a camera on top the Space Needle. I implemented the model in Keras using Xception architecture with transfer learning, instantiated with weights pre-trained on ImageNet. The convolutional base is reduced by a 2D global average pooling layer followed by a dropout layer and a fully connected layer reducing down to a single neuron with linear activation for the final prediction of an image's score. All but the top 4 blocks of the convolutional base were frozen during training. The top performing model used the following parameters:
- Dropout rate: 0.6
- Optimizer: stochastic gradient descent, learning rate = 0.0001, momentum = 0.9, clip value = 0.5
- Loss function: mean squared error
Tools
General
- Python
- Numpy
- Pandas
- Jupyter Notebook
Cloud
- AWS S3
- AWS EC2
Deep Learning
- Keras
- TensorFlow
- TensorBoard
- Sci-kit Learn
Visualization
- Matplotlib
- Seaborn
- Sci-kit Learn
- TensorBoard
- PIL
Data Source
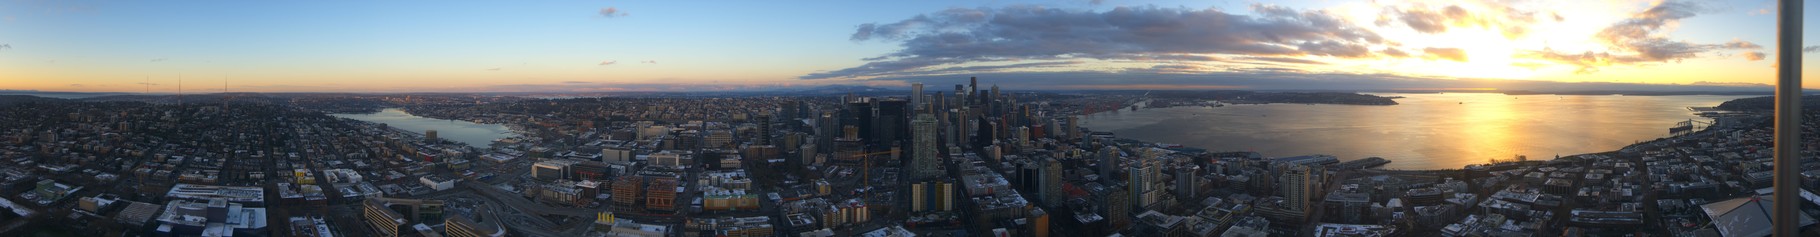
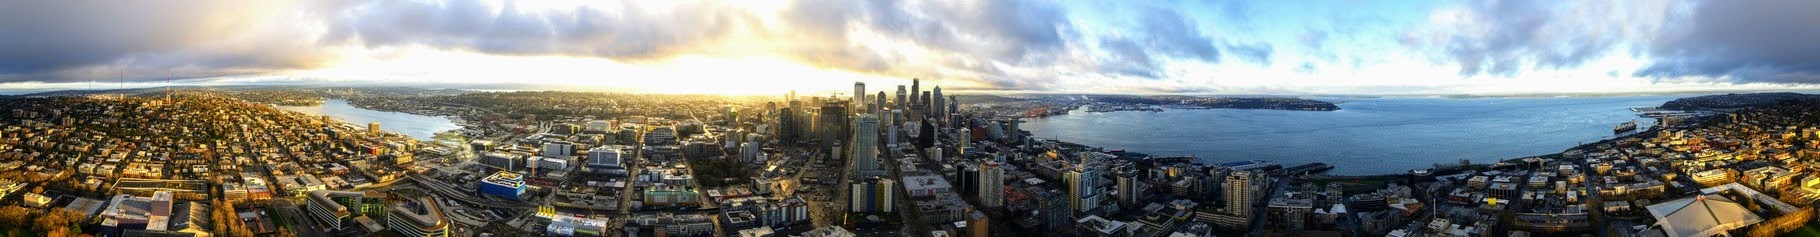
My data source for this project was the panoramic photos taken by the camera on top of the space needle. Check out their gallery here. The camera has been taking one image for every ~10 minutes of daylight since the beginning of 2015, amounting to approximately 130,000 images now. After some sleuthing through the page's source code, I found links to the site's filesystem, which they've left exposed. For each panorama photo, there's a folder has 17 high resolution slices that make up the panorama, as well as a low resolution (237x1820) thumbnail image with all the slices stitched together. Gold mine! I spun up an EC2 instance and wrote a script to crawl their entire file tree and duplicate all of the thumbnails (about 14 GB) into an AWS S3 bucket. Good to go!
Data Preparation
We can't very well have our model running around looking at photos without a goal, so next I needed to get some labels on my data. I started out treating this as a classification problem, with the goal of specifically labeling a photo as either beautiful or not. This is of course playing with devil, because what kind of fuzzy boundary around a category is that? How could that possibly be objective?What even is beauty? Oh, these questions tumbled around in my brain and I reveled in the challenge of how best to approach it. As for actually getting these scores, I considered my options:
- Mechanical Turk - I could devise an easy-to-follow scoring system and sick the crowd on it. So long as my instructions were clear and I had good accountability measures in place to make sure my turks were well-behaved and not turkeys or headless Selenium drivers, this would likely yield robust results. On the flip side, this will probably take me several hours to get set up, and costs money (and I'm not being paid for this).
- Heroku App - I could throw together a quick hot-or-not style app and send it to all my friends. Really this is the same solution as mechanical turk, but a bit closer to free. And perhaps it would have been the better option? But it's not what happened. Instead I opted for the ol'
- Do it myself - I didn't want to spend the money, and I had doubts about whether or not I'd be able to get the necessary scale of responses I wanted by leaning on my social network—how much time would any of them really voluntarily devote to scoring photo after photo of the Seattle skyline? And I didn't really want to make that ask. So I bit the bullet and did it myself.
I wrote myself a scoring program in Jupyter notebook that I could use to quickly flip through and score photos. I thought about all the potential strategies. Implement a manual version of insertion sort? Treat it like a bracket and do lots of A vs B comparisons? These seemed like cool strategies, but also like the time complexity would kill me. I wanted a way to generate 2000+ scores in less than 10 hours of work with informative gradations and as high a degree of consistency as practical. That's…kind of a big ask. So here's how I did it.
Data Labeling
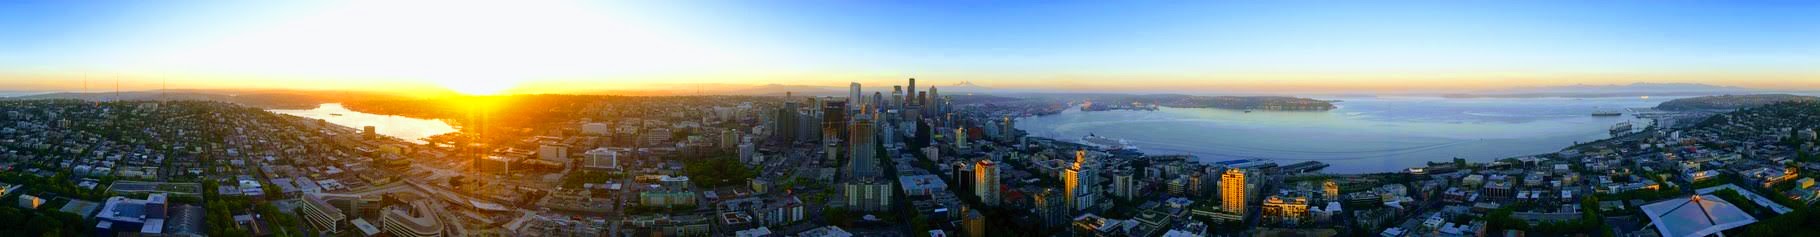
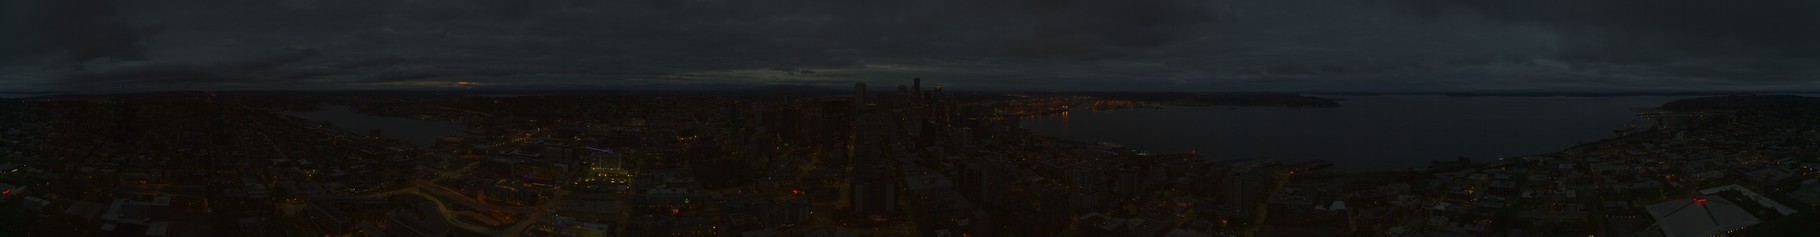
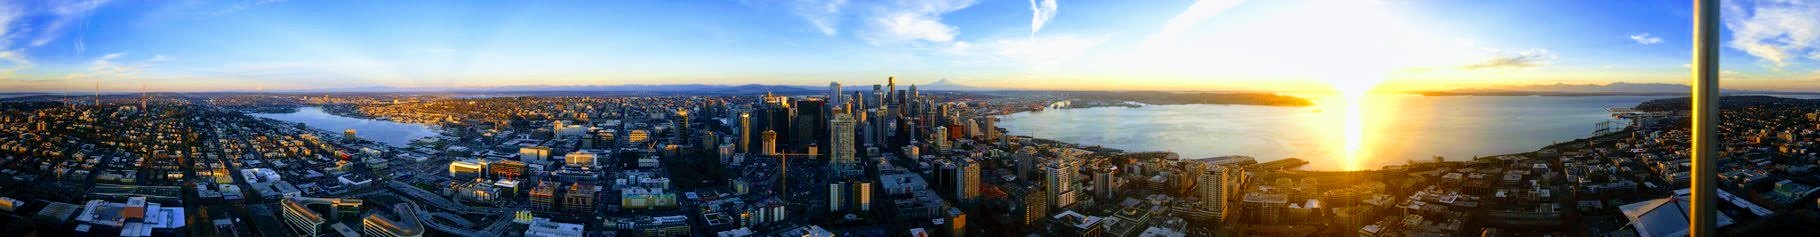
I randomly drew 4 images at a time from my S3 bucket, and then was faced with a prompt to enter the indices for the images I want to advance to the next round. It's like a tournament bracket…but because I'm a smart human that doesn't need strict rules, there's no constraint on how many choices I make in a round. This allowed me to avoid that obstacle of "what if they're both really similar!" Rather than always having to advance and discard some number, I instead kept track of my overall acceptance rate and tried to roughly peg that at a particular threshold. Starting out, I aimed for a 50/50 split, since as a baseline I wanted at least verify the model could work on a balanced dataset. The difference between these might be something like this:
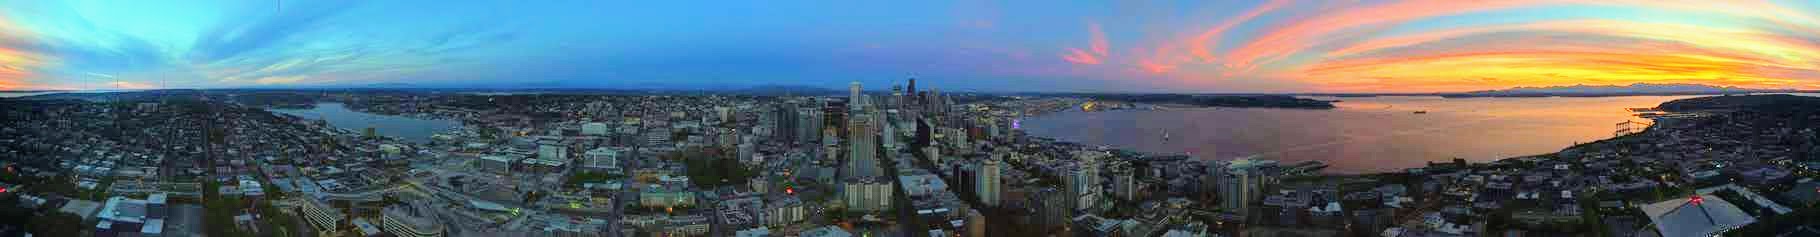
Once I got a model predicting at > 90% accuracy on my split (more on that later), I decided to up the ante. I fed my positive class back into my labeling program for a second round. This time I went more aggressive and tried to select all the way up to the 95th percentile of photos. This tended to be a tight enough threshold that most of the images were low in defects and also had something interesting about them, be it good lighting, dynamic clouds, a colorful sunset, absolute clarity...
But that wasn't enough for me. I narrowed down one tier further to identify my top 2% of photos. These were the real upper crust. Still not always devoid of flaws, but generally in quite good shape and some fo the most compelling scenes.
At this point, I knew I'd be running into a severe class imbalance issue without substantially increasing the number of photos I sifted through, so I left it here for the time being.
Data Labeling Round 2!
I was right, that class imbalance was an issue! Even after labelling over 3200 photos, a 64/16/20 train/crossval/test split meant that trying to identify the top 2% of images would give me a meager 11 positive class photos in my validation set, even with tools like image augmentation and oversampling at my disposal…I'm sorry, no, that's just not going to be enough.
Modeling
For the modeling, I decided to implement a convolutional neural network using Keras and Tensorflow. After surveying architectures implemented in Keras that also have pre-trained weights, I opted to use the Xception architecture based on it's combination of high reported accuracy and relatively low size and parameter counts as compared to the new old guard architectures like VGG 16/19.
I chopped off the model at the latent vector output by the convolutional base and tacked my own predictor onto the end. I experimented with several potential arrangements, but ended up settling on prediction setup like the following:
- 2D global average pooling layer
- Dropout layer (rate = 0.6)
- Fully connected layer
- Output neuron(s)
As mentioned before, I initially started out treating this as a classification problem, and followed the advice of the Xception authors by setting up the output as two neurons with softmax activation. This allowed me to easily easily interpret my results according to whether or not a photo I'd classified as being categorically "beautiful" was also recognized as such by the model. To measure the performance, I implemented an F2 metric that would only be computed once per epoch (F2 because I wanted to place higher emphasis on recall than precision, as I'd prefer to do a little bit of extra sorting if it means I don't lose miss out on a real gem). I experimented with several optimizers and loss functions, but ultimately my best parameters were as follows:
- Stochastic gradient descent: learning rate = 0.0001, momentum = 0.9, clip_value = 0.5
- Loss function: categorical cross entropy
Ultimately, the best performance I got on this model while targeting the top 5% of photos was an F2 score of 0.27. Which was decent, but the more I fished around in the probability estimates and tried to determine what was hindering performance, the more I really started getting the itch that my problem had somehow transformed from a classification problem to a regression problem, albeit a very low resolution regression problem. Based on the mode by which I'd scored the data, I now had a 4-class dataset, but these classes were ordinal. And not just that, but also their distances were actually somewhat meaningful. And my classification model was totally disregarding some of that information, and I didn't like that. I could treat it as a multi-label classification problem, but that doesn't account for the ordering.
Pivot!
So now I was building a regression model. But as it turns out, there's a simple way to do this that requires barely any change at all (to the model). To convert my prediction block to a regression, I changed the output from two neurons with softmax activation to one output with linear activation. And that's it! Well, mostly. Other things I changed:
- Optimizer: rmsprop
- Loss function: mean_squared_error
The only other changes that were required were modifications to the pipeline feeding the data into the model, such as transforming my labels into more useful target scores and adjusting the data generators to reference the correct variable.
Results
Overall, both models did a pretty good job of filtering out the bad photos. But how do we actually compare the performance of a regression model to a classification model? For this context, I decided to look at it through lens of time-savings. Supposing my goal is to have my model filter the dataset down to the smallest dataset it can while still maintaining the top 5% of photos, what percent gallery reduction can I achieve?
- Classification: 42% reduction in gallery size
- Regression: 24% reduction in gallery size
Alas, despite all my hopes and dreams for the regression model, the classifier actually won out! Interpreting these results, this effectively means that if previously an editor were to spend 10 hours sifting through a gallery to select the images, they could now apply this model as a first pass filter and save themselves 4 hours of work!
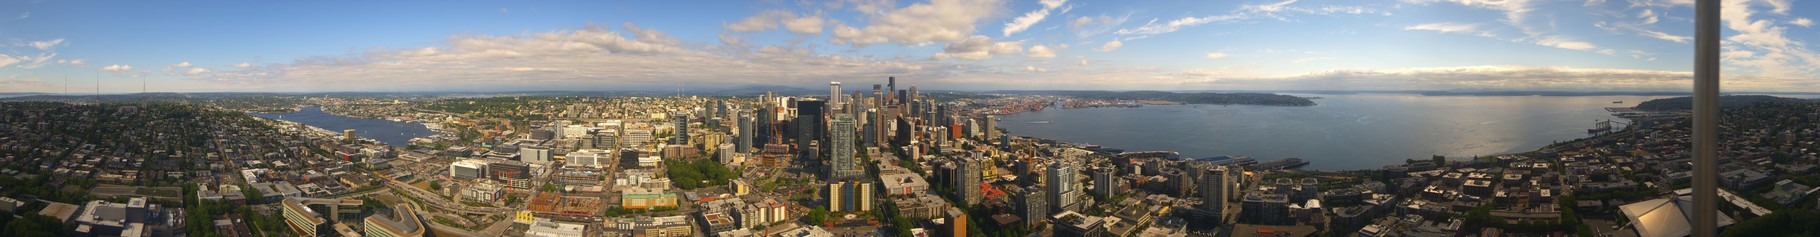
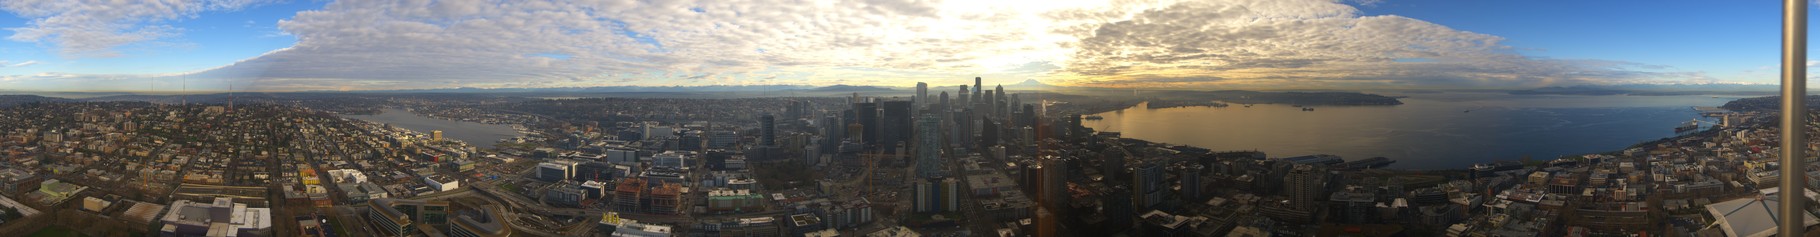
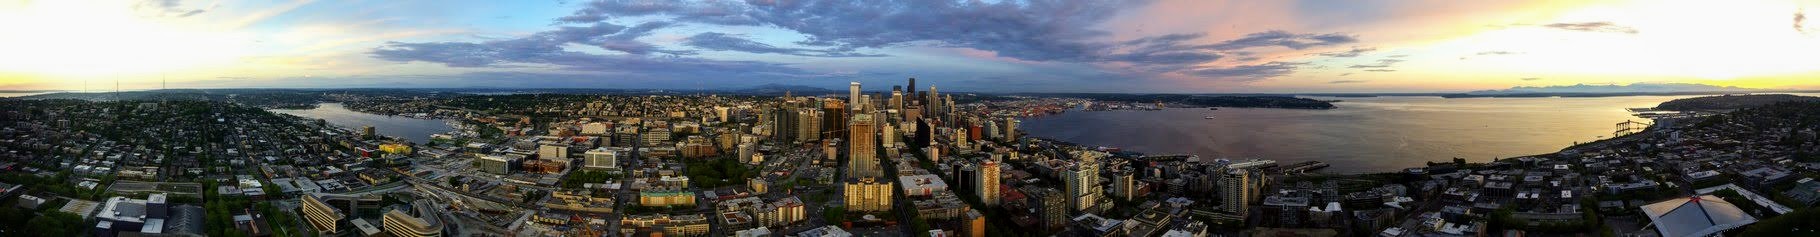
Of course, what's the point of all this work if we don't actually apply the model to the broader dataset! Let's have a look at some of the images that scored the highest when I finally applied the model to the broader 130,000+ image dataset.
Conclusion
In it's current state, the project has made significant progress towards demonstrating the potential for an intelligent neural network to be able to learn about our aesthetic sensibilities and filter the best photos from a chaotic collection. That said, there's ample improvements that can be made. The labeling and scoring in this prototype is still quite crude, and I'd love to increase the fidelity by crowdsourcing the scores with a more defined metric and methodology. The dataset of space needle images is fun, but quite specific. For this model to be truly useful to a photographer, I'd want to train a model on images more akin to the types of settingts they shoot in, and perhaps even add functionality to fine tune the model as a user applies the model to their data, learning the particulars of their taste and style. Additionally, there are many sorts of features that could be built on top of this architecture, such as capturing the model's latent vectors prior to classification and using them to identify images most similar to a selected picture. Always more to do!
Comments
comments powered by Disqus